Hattie Discusses What to Consider, Not How to Implement It . . . More Criticisms, Critiques, and Contexts
Dear Colleagues,
Introduction
By the time you read this Blog, I will have just landed in Singapore where I am one of six presenters at the World EduLead 2019 Conference [CLICK HERE] sponsored by the International Association for Scholastic Excellence (INTASE).
During my week here, I will be presenting two full-day Master Classes, two Keynotes, and a Symposium with Michael Fullan (School Leadership), Carol Ann Tomlinson (Differentiated Instruction), and three other international education greats.
Altogether, I will be presenting the following:
- Seven Evidence-Based Strategies to Systemic Success in Schools
- The Seven C’s of Success: Strengthening Staff Relationships to Ensure Student Success
- School Reform: Strategic Planning, Shared Leadership, and Student Success
- Helping Hattie Work: Translating Meta-Analysis into Meaningful Student Learning Outcomes
While re-researching John Hattie’s work for last full-day presentation, I uncovered new “criticisms, critiques, and contexts” that motivated me to update at least two past Hattie Blog messages with this new one.
My previous Hattie-focused Blogs include (along with a third “application” Blog):
July 21, 2018. Hattie Haters and Lovers: Both Still Miss the Effective Implementation that Practitioners Need. Critical Questions to Ask your “Hattie Consultant” Before You Sign the Contract
[CLICK HERE to Read]
_ _ _ _ _
September 25, 2017. Hattie’s Meta-Analysis Madness: The Method is Missing!!! Why Hattie’s Research is a Starting-Point, but NOT the End-Game for Effective Schools
[CLICK HERE to Read]
_ _ _ _ _
August 26, 2017. The Top Ten Ways that Educators Make Bad, Large-Scale Programmatic Decisions: The Hazards of ESEA/ESSA’s Freedom and Flexibility at the State and Local Levels
_ _ _ _ _
As is evident from these titles, there are very specific concerns with Hattie’s research and how it is being used.
In this Blog, we will describe these concerns in detail, and then discuss examples of how Hattie’s work can be effectively and defensibly implemented—from a science-to-practice perspective—for students, by staff, and in schools.
To accomplish this, we will (a) briefly overview the concerns; (b) present a primer on meta-analysis; (c) quote from the concerns of three notable researchers; (d) discuss how to go from “effect to effective practice;” and (e) describe the questions to ask the “outside” Hattie consultant—before you hire him or her.
_ _ _ _ _ _ _ _ _ _
A Brief Overview of Concerns with Hattie’s Research
Over the past decade especially, John Hattie has become internationally-known for his meta-meta-analytic research into the variables that most-predict students’ academic achievement. Indeed, some view his different Visible Learning books (which have now generated a “Hattie-explosion” of presentations, workshops, institutes, and “certified” Hattie consultants) as the books of an educational “Bible” that shows educators “the way” to succeed with students.
As such, Hattie has assumed a “rock star” status. . . which creates an illusion that his work is “untouchable,” that it cannot be critiqued, and that it certainly can’t be wrong.
As of this writing, Hattie’s research is based on the synthesis of over 1,500 meta-analyses comprising more than 90,000 studies involving more than 300 million students around the world. In more statistical terms, Hattie takes others’ published meta-analyses—investigating, for example, a specific educational approach (e.g., cooperative learning) or intervention (e.g., Reading Recovery), and he pools them together—statistically conducting a meta-meta-analysis.
In doing this, he averages the effect sizes from many other meta-analyses that themselves have pooled research that investigated—once again—the effect of one psychoeducational variable, strategy, intervention, or approach on student achievement.
_ _ _ _ _
While the magnitude and sheer effort of what Hattie has done is impressive. . . there are a number of major methodological problems with his statistical approaches and interpretations; and a number of additional major science-to-practice implementation problems.
To foreshadow the more comprehensive discussion later in this Blog, below is an example of one of his primary methodological problems, and one of his primary implementation problems.
Educators need to fully understand these problems in order to be able to benefit—especially on behalf of their students—from this research.
_ _ _ _ _
An Example of a Methodological Problem in Hattie’s Research
One major methodological problem is that Hattie’s statistical analyses may be flawed.
More specifically, a number of notable statisticians (see the section on this below) have questioned whether the effect sizes from different independent meta-analyses can be averaged and pooled into a single meta-meta-analytical effect size—which is exactly what Hattie is doing.
As such, they don’t believe that the statistical approach used by Hattie in his research is defensible. . . which means that some of his research results may be incorrect.
Metaphorically, what Hattie is doing is akin to averaging the average temperatures for 100 years of each day in March. . . and then saying that the 100-year average temperature for March in, say, Washington, D.C. is 48 degrees (it actually is—I looked this up).
While you can statistically calculate this, the conclusion—regarding the 48 degree average temperature—may not be functionally accurate or, more importantly, meaningful (if you are planning a trip to DC).
First of all, in a typical year, Washington, D.C.’s March temperature may range from 37 degrees on one day to 59 degrees on another day—a variance of 22 degrees. So, even in looking at one year’s worth of March temperatures, you need to statistically address the temperature range during any specific month. . . and then you need to look at this variability over 100 years.
Given all of this, the 48 degree 100-year average clearly does not accurately tell the entire story.
The “single” temperature is compounded by the fact that there may be different “micro-climates” in Washington, D.C. Thus, the daily temperature on any one March 15th, for example, may be 45 degrees in the Northwest part of the city, but 52 degrees in the Southeast part.
Finally, from year to year. . . over 100 years. . . there may be some seasons that are colder or warmer than others. Not to get political, but if we were to factor in the impact of Global Warming, it may be that the most-recent 10-year March temperature is significantly warmer than the average temperatures for the 90 years before. . . and, therefore, more accurate and meaningful for our current needs.
_ _ _ _ _
There is, at least, one additional embedded issue. Measuring temperature is scientifically far more reliable and valid than the diverse measures used in different studies (or at different times in a school) to measure student achievement. A temperature is measured by a thermometer, and most thermometers will give basically the same reading because they are scientifically calibrated instruments.
With the meta-analyses used by Hattie, different researchers operationalize “student achievement” (as an independent outcome measure) in different ways. Even if a bunch of them operationalize student achievement the same way, they still may use different measurement tools or metrics. . . that provide significantly different results.
Thus, the measurement of achievement is going to have far more variability from Hattie study to study than a thermometer in Washington, D.C. in March.
_ _ _ _ _
An Example of an Implementation Problem in Hattie’s Research
The one major implementation problem that we will discuss right now is that, in a specific effect size area, educators need to know the implementation methods that were used in all of the studies included in the original meta-analytic studies that Hattie pooled into his meta-meta-analyses.
The point here is that, unless a program or intervention has been standardized in a specific effect area, and the same program or same intervention implementation steps were used in every study included in a meta-analysis or Hattie’s meta-meta-analyses in that area, it is possible that one implementation approach contributed more to the positive effect size on student achievement than another approach.
For example, given Hattie’s current data, “cognitive task analysis” has a 1.29 effect size relative to positively impacting student achievement. It is unlikely, however, that every study in every meta-analysis pooled by Hattie used the same step-by-step implementation process representing “cognitive task analysis.”
Thus, Hattie’s research tells us what to consider (i.e., cognitive task analysis), but not necessarily the specific research-validated steps in how to implement it.
For an individual school to implement the cognitive task analysis approach or steps that contributed most to the positive effect size that Hattie reports, its leaders need to know—statistically and relative to their implementation steps—what individual studies were integrated into the meta-analyses and Hattie’s meta-meta-analysis.
But they also need to know which studies were done with the same type of students (e.g., gender, socio-economic status, race, geographical location, type and quality of school, etc.) that they are currently teaching in their school.
That is, it may be that the students involved in the meta-analytic studies used by Hattie do not match the students in the schools that we are working with. Thus, while the research used by Hattie may be “good” research (for some students in some schools in some communities), it may not be the “right” research for our students, schools, and community.
To summarize so far: If schools are going to use Hattie’s research in the most effective way for their specific students, a Multiple-gating process of decision-making must be used.
This Multiple-gating Process should include:
- Step 1. Identify your school’s history and status, resources and capacity, and current positive and needed outcome relative to student achievement.
- Step 2. Determine which Hattie variables will most improve student achievement—with a constant awareness that many of these variables will interact or are interdependent.
- Step 3. Evaluate the methodological and statistical quality and integrity of the meta-analytic studies that Hattie included in his meta-meta-analyses.
NOTE: If Hattie’s meta-meta-analysis has flaws or included flawed meta-analytic studies, identify the best separate meta-analysis studies and continue this multiple-gating process.
- Step 4. Evaluate the demographics and other background characteristics of the schools, staff, and students involved in the meta-analytic studies used by Hattie in his meta-meta-analyses to validate that they match the school demographics and background characteristics where you plan to implement the program, strategy, or intervention.
- Step 5. Using and analyzing Hattie’ best meta-meta-analytic study (or the best individual meta-analysis studies—as immediately above), identify what program(s) or strategy(ies), and what specific implementation approaches and steps were most responsible for the positive effects on student achievement.
- Step 6. Finalize the select of your program or strategy, and its implementation approaches and steps, and develop an Implementation Action Plan that identifies who will be involved in implementation, what training and resources they need, how you will engage the students (staff, and parents), how you will evaluate the short-and long-term student achievement outcomes, and what will be the implementation steps and timelines.
- Step 7. Resource, train, engage, implement, evaluate, fine-tune, implement, and evaluate.
_ _ _ _ _
As we proceed to the next section of this Blog, let me be clear. This Blog was not written to criticize or denigrate, in any way, Hattie on a personal or professional level. He is a prolific researcher and writer, and his work is quite impressive.
However, this Blog will critique the statistical and methodological underpinnings of meta- and meta-meta-analytic research, and discuss its strengths and limitations. But most essentially, the focus ultimately will be on delineating the research-to-practice implications of Hattie’s work, and how to implementation it with students in the most effective and efficient ways.
_ _ _ _ _
To this end, and once again, it is important that educators understand:
- The strengths and limitations of meta-analytic research—much less meta-meta-analytic research;
- What conclusions can be drawn from the results of sound meta-analytic research;
- How to transfer sound meta-analytic research into actual school- and classroom-based instruction or practice; and
- How to decide if an effective practice in one school, classroom, or teacher is “right” for your school, classrooms, and teachers.
While this all provides a “working outline,” let’s look at some more details.
_ _ _ _ _ _ _ _ _
A Primer on Meta-Analysis
What is it?
A meta-analysis is a statistical procedure that combines the effect sizes from separate studies that have investigated common programs, strategies, or interventions. The procedure results in a pooled effect size that provides a more reliable and valid “picture” of the program or intervention’s usefulness or impact because it involves more subjects, more implementation trials and sites, and (usually) more geographic and demographic diversity. Typically, an effect size of 0.40 is used as the “cut-score” where effect sizes above 0.40 reflect a “meaningful” impact.
Significantly, when the impact (or effect) of a “treatment” is consistent across separate studies, a meta-analysis can be used to identify the common effect. When effect sizes differ across studies, a meta-analysis can be used to identify the reason for this variability.
_ _ _ _ _
How it is done?
Meta-analytic research typically follows some common steps. These involve:
- Identifying the program, strategy, or intervention to be studied
- Completing a literature search of relevant research studies
- Deciding on the selection criteria that will be used to include an individual study’s empirical results
- Pulling out the relevant data from each study, and running the statistical analyses
- Reporting and interpreting the meta-analytic results
As with all research, and as reflected in the steps above, there are a number of subjective decisions that those completing a meta-analytic study must make. And, these decisions could be sound, or they could be not so sound. They could be defensible, or they could be arbitrary and capricious. They could be well-meaning, or they could be biased or self-serving.
Thus, there are good and bad meta-analytic studies. And, educators are depending on the authors of each meta-analytic study (or, perhaps the journal reviewers who are accepting the study for publication) to include only those studies that are sound.
By extension, educators also are depending on Hattie to include only those well-designed and well-executed meta-analytic studies in his meta-meta-analyses.
But, unfortunately, this may not be the case.
In his 2009 Visible Learning book, Hattie states (pg. 11), “There is. . . no reason to throw out studies automatically because of lower quality.”
This suggests that Hattie may have included some lower quality meta-analytic studies in some (which ones?) of his many meta-meta-analyses.
Indeed. . . What criteria did he use to when including some lesser-quality meta-analytic studies? How did he rationalize including even one lower quality study? But—most importantly—how did these lower quality studies impact the results of the effect sizes and functional implications of the research?
These are all important questions that speak directly to the educators who are trying to decide which Hattie-endorsed approaches to use in their pursuit of improved student achievement scores. These questions similarly relate to educators’ decisions on how to effectively implement the approaches that they choose.
_ _ _ _ _
How do you Interpret an Effect Size?
As noted above, Hattie (and other researchers) use an effect size of 0.40 as the “cut-score” or “hinge point” where a service, support, strategy, program, or intervention has a “meaningful” impact on student achievement.
Visually, Hattie represents the continuum of effect sizes as a “Barometer” (see below).
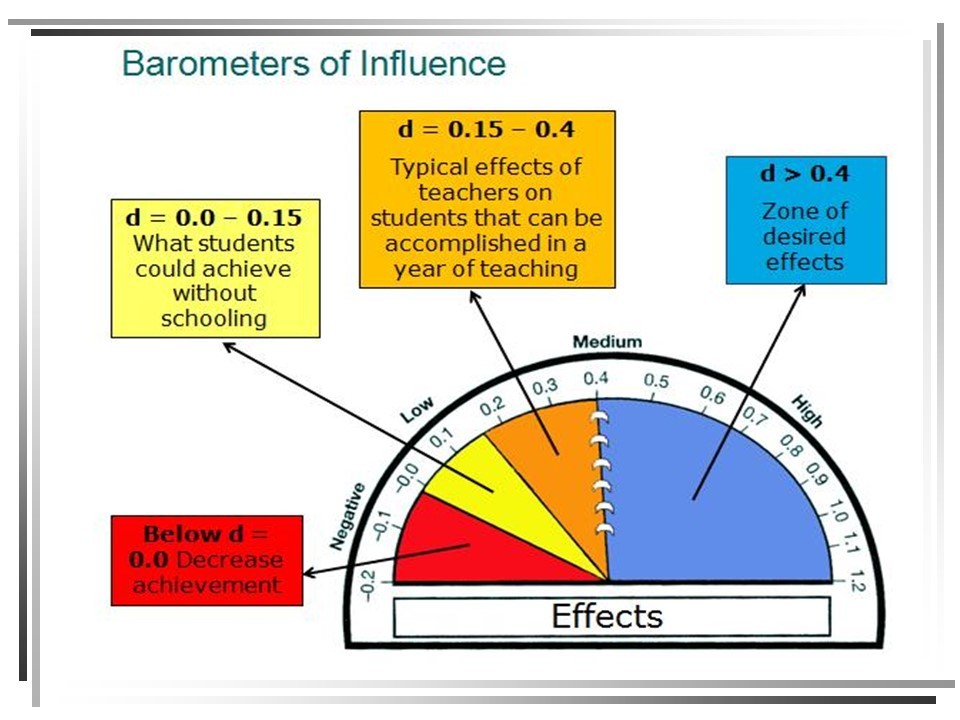
But this doesn’t tell the entire story. In fact, some researchers are very uncomfortable with this barometer and how Hattie characterizes some of the effect sizes along the continuum.
_ _ _ _ _
Matthew A. Kraft, from Brown University, is one such researcher. In his December, 2018 working paper, Interpreting Effect Sizes of Education Interventions, Brown identified five guidelines when interpreting effect sizes in education. These guidelines are summarized below.
[CLICK HERE for this paper]
Kraft’s Effect Size Interpretation Guideline #1. The results from correlational studies, when presented as effect sizes, are not causal effects. Moreover, effect sizes from descriptive and correlational studies are often larger than causal studies.
Implication. When Hattie reports that a specific program or intervention has a strong effect size relative to student achievement, he is most often meaning (a) that there is a contributory (not causal) relationship between the program and student achievement; and thus (b) that students experiencing that program have a higher probability of increasing their achievement when compared with students who have not experienced that program.
Once again, he is not suggesting that the program caused the achievement. In fact, the program might be enhancing another factor that actually is more directly causing the increase in student achievement.
Example. Hattie’s most up-to-date November, 2018 research concludes that Phonics Instruction has a strong 0.70 effect size on student achievement.
Hypothetically (yet, most probably), let’s say that most of the research contributing to this effect size involved correlational studies that compared Kindergarten through Grade 3 students who learned to read through phonics-based literacy instruction with students who were taught using other literacy instruction approaches. These studies then, for example, looked at all of these students’ high school Grade Point Averages (GPAs) when they graduated from 12th grade.
Per Hattie, the meta-meta-analytic result of pooling all of the separate meta-analyses of the hypothetical studies above was a 0.70 effect size.
But what does this mean?
A 0.70 effect size technically means that:
- 76% of the K to Grade 3 phonics-taught students’ high school GPAs will be above the average high school GPA of the K to Grade 3 non-phonics taught comparison group.
- In addition, 73% of the two groups’ GPAs will overlap, and there is a 69% chance that a student picked at random from the Phonics Instruction group will have a higher GPA than a randomly-chosen student from the Non-Phonics Instruction group.
The latter percentage is called the “probability of superiority.”
- In the end, for every 100 students receiving Phonics Instruction in K to Grade 3, 24 of these students will have a higher GPA than if they had not received phonics instruction.
[CLICK HERE to see a great interactive effect size calculator where you can input the effect size, and its meaning (as immediately above) is automatically described]
_ _ _ _ _
As you can see from the description above, an effect size here is correlational and not causal. If the phonics instruction-to-student achievement relationship were causal, 100% of the students receiving that approach would out-perform (i.e., have higher high school GPAs) 100% of the non-phonics-taught students.
But, finally, let’s reinforce the earlier point about the potential presence of a “third” factor or variable that may better explain the initial effect size relationship.
What if—as is possible—students who learn how to read using phonics instruction demonstrate higher levels of reading comprehension from Grade 3 through Grade 12 than students where phonics instruction was not used.
In this scenario, the (a) phonics instruction impacted (b) students’ comprehension which helped them (c) to understand and learn material more easily, which helped (d) increase their GPA. Thus, the initial phonics instruction, for many students receiving it, “triggered” a chain of events that more fully explains the “static” 0.70 phonics instruction-to-student achievement effect size.
Critically, this (as above) is what educators need to understand and think through when they read a Hattie effect size. . . or when it is presented in a Hattie workshop or cited by a “Hattie Consultant.”
There is critical context here. Hattie’s effect size posters or charts are not restaurant menus. Once again, they largely tell us what to consider, but there is so much between consideration and implementation.
_ _ _ _ _
Kraft’s Effect Size Interpretation Guideline #2. The magnitude of effect sizes depends on what outcomes are evaluated and when these outcomes are measured.
Implication. As we have already discussed, it is important to know how different researchers defined and measured “student achievement” when they conducted their research on a specific strategy, program, or intervention. In addition, it is important to know when and how often they measured for the “student achievement” in their study.
Finally, it is important to know how many different student achievement definitions, measures, and data collection timeframes are represented in any single meta-analysis. . . and then how these differences were pooled when Hattie took different meta-analyses and included them in his meta-meta-analysis.
Some basic meta-analytic results here are:
- Expect outcomes affected by short-term decisions and effort to be larger than outcomes that are the result of cumulative decisions and sustained effort over time.
- Expect outcomes that are more closely aligned with the intervention to have larger effect sizes than those that measure broader or more generalized outcomes.
- Expect outcomes measured immediately after the intervention to have larger effect sizes than outcomes measured later.
This all means that schools should not implement some strategies or programs when the research underlying their reported effect sizes do not match the school’s desired implementation outcomes or intended timeframes.
Example. If schools are looking for longer-term (e.g., over the course of an entire school year) and more global (e.g., state test score proficiencies) outcomes than reflected in the Hattie research for a specific effect size, they probably should “pass” on the strategies or programs involved, and look at research studies that more closely mirror their goals.
_ _ _ _ _
Kraft’s Effect Size Interpretation Guideline #3. Effect sizes are impacted by subjective decisions researchers make about the study design and analyses.
Implication. We addressed this Guideline earlier when we discussed the effective size results for Cognitive Task Analysis” and concluded that it was unlikely that every study in every meta-analysis pooled by Hattie used the same step-by-step cognitive task analysis implementation process.
The functional meta-analytic outcomes here include:
- Expect studies with more targeted samples, more homogeneous, and less representative samples to have smaller variation in their outcomes and, thus, lar
- Expect studies to have larger effect sizes when control groups do not have access to resources or supports similar to the intervention.
- Expect studies that report the effect of offering an intervention (e.g., tutoring) to have smaller effect sizes than studies that report the effect of receiving a more-targeted intervention.
Another Example. Hattie reports that Behavior Interventions have a .62 effect size for student achievement. But exactly what specific behavioral interventions (of the twenty or more available) are represented (or most represented) in the research included in the meta-analyses that Hattie pooled into his meta-meta-analysis?
Moreover, were the students involved in these studies general education students, students with disabilities (and, then, which disabilities), alternative education students, or juvenile justice-placed students?
At what age or grade level were the students?
Did the studies use a Comparison Group, a Matched Control Group (that received no special staff interactions), or a Matched Attention-Control Group (that received the same amount of attention as the Intervention Group, but “neutral” or non-intervention-based attention)?
All of this information is critical because it allows educators both to evaluate the integrity of the research that contributes to any Hattie effect size, and to validate that the students involved in the research match the students in their schools who they are targeting for the program or intervention.
_ _ _ _ _
Kraft’s Effect Size Interpretation Guideline #4. Strong program or intervention effect sizes must be covaried with how much it costs to implement the program or intervention—both relative to the initial start-up and ongoing maintenance.
Implication. While most researchers do not report the costs or cost-benefits of their programs or interventions, this is an important consideration for educators in the field. To estimate the costs, educators can review the individual studies that contributed most to the meta-analytic or meta-meta-analytic results as these studies’ implementation methods and steps can suggest how expensive a program or intervention will be to initiate and then maintain.
Indeed, while it’s nice to know that specific programs or interventions have a strong impact on student achievement, if they are too expensive to implement or maintain, the strong effect size may be less relevant.
These implementation characteristics are even more important given our earlier discussion of exactly what an effect size means—relative to the probability of a program or intervention impacting specific percentages of participating (or receiving) versus non-participating (or non-receiving) students.
Thus, in the end, schools may do well to select programs or interventions that have smaller (but significant) effect sizes, but that can be implemented and maintained in the most cost-effective ways.
Example. Rogers and Feller (2018) found that delivering personalized information to parents about their students’ absenteeism reduced total absences by 6%. Student absences obviously connects with many, many Hattie effects that can only occur if students are attending school.
The personalized information intervention cost between $1 and $15 per student.
The question ultimately is: Does the cost of this intervention and the predicted number of students positively impacted represent a good “return-on-investment” for the school—in the context of everything else that it is doing and funding?
_ _ _ _ _
Kraft’s Effect Size Interpretation Guideline #5. The ease or difficulty in scaling-up a program or intervention also matters when evaluating the policy relevance of effect sizes.
Implication. Adding to the cost-effectiveness (See Guideline #4) of a program or intervention is its complexity and/or difficulty relative to scaling it up across an entire group of students, school, or district
This, once again, can only be determined by analyzing the individual studies that contributed most to a program or intervention’s meta-analytic or meta-meta-analytic results.
More specifically, programs are unlikely to scale with fidelity and maintain their effectiveness if they are (a) only effective with a narrow population; (b) entail substantial behavioral changes (both of staff and students); (c) require a skill level greater than that possessed by the typical educators in a school; (d) face considerable opposition among the staff, students, and/or parents; (e) are prohibitively costly; or (f) depend on the charisma of a single person or a small group of highly-trained and dedicated individuals.
Example. Hattie has calculated a strong effect size (0.88) for the impact Micro-teaching and Video Review of Lessons on student achievement. At the same time, the research suggests that these approaches improve the effectiveness of teacher instruction, and this instruction is what has the more direct effect on student achievement.
But beyond this, statewide teacher coaching programs are expensive and staff-intensive, they are difficulty to sustain (both relative to budget and effort), and they have not resulted in the large student achievement gains that have been documented in more controlled and “small-scale” studies.
This, then, is a good example of where the research does not translate (as hoped) into practice. Educators need to understand not just the characteristics of the research that contributed to the large effect size, but also the research showing that, pragmatically, it is not easy to scale-up these approaches to have large, systemic success.
_ _ _ _ _
Summary: What Questions should Educators Ask when Reviewing a Meta-Meta-Analytic Result?
To summarize this section, educational leaders cannot assume that “all research is good because it is published,” and they cannot assume that even “good” meta-analytic research is applicable to their communities, schools, staff, and students.
And so, educational leaders need to independently evaluate the results of any reported meta-analytic research—including the meta-meta-analytic research discussed by Hattie—before accepting and taking action on the results.
Among the questions that leaders should ask when reviewing (or when told about the results from) Hattie’s or others’ meta-analytic research are the following:
- Do the programs, strategies, or interventions chosen for investigation use similar implementation steps or protocols?
- Are the variables investigated, by a meta-analytic study, variables that are causally- versus correlationally-related to student learning, and can they be taught to a parent, teacher, or administrator?
- In conducting the literature review, did the researchers consider (and control for) the potential of a “publication bias?”
- What were the selection criteria used by the author of the meta-analysis to determine which individual studies would be included in the analysis, and were these criteria reliably and validly applied?
- Were the best statistical methods used in the meta-analysis? Did one or two large-scale or large-effect studies outweigh the results of other small-scale, small-participant studies that also were included? Did the researcher’s conclusions match the actual statistical results from the meta-analysis?
I have “asked and answered” these questions in my September 25, 2017 Blog.
Clearly, these questions must be answered for the individual meta-analyses used in any meta-meta-analytic study.
_ _ _ _ _ _ _ _ _ _
Others’ Concerns with Hattie’s Research
While we have expressed, directly or indirectly, some of the primary concerns with Hattie’s research above, it important to include two additional voices so that educators have a full understanding of the concerns.
In a past Blog, we discussed the concerns of Dr. Robert Slavin from John’s Hopkins University. We will summarize his concerns below, and then add the perspectives of Drs. Pierre-Jerome Bergeron and Lysanne Rivard (from the University of Ottawa and McGill University, respectively) who wrote an article in the McGill Journal of Education titled, “How to Engage in Pseudoscience with Real Data: A Criticism of John Hattie’s Arguments in Visible Learning from the Perspective of a Statistician.”
_ _ _ _ _
Robert Slavin’s June, 2018 Concerns with Hattie’s Work
Dr. Robert Slavin is, himself, an exceptional researcher in his own right. Slavin is the primary author, researcher, and implementer of Success for All, an evidence-based literacy (and math) program that is one of the longest-standing, best-researched, and most-effective instructional approaches in recent history.
On June 21, 2018, Slavin published a Blog, John Hattie is Wrong, where he reported his analyses of Hattie’s research. Below are the essential snippets from his Blog:
However, operating on the principle that anything that looks to be too good to be true probably is, I looked into Visible Learning to try to understand why it reports such large effect sizes. My colleague, Marta Pellegrini from the University of Florence (Italy), helped me track down the evidence behind Hattie’s claims. And sure enough, Hattie is profoundly wrong. He is merely shoveling meta-analyses containing massive bias into meta-meta-analyses that reflect the same biases.
Part of Hattie’s appeal to educators is that his conclusions are so easy to understand. He even uses a system of dials with color-coded “zones,” where effect sizes of 0.00 to +0.15 are designated “developmental effects,” +0.15 to +0.40 “teacher effects” (i.e., what teachers can do without any special practices or programs), and +0.40 to +1.20 the “zone of desired effects.” Hattie makes a big deal of the magical effect size +0.40, the “hinge point,” recommending that educators essentially ignore factors or programs below that point, because they are no better than what teachers produce each year, from fall to spring, on their own.
In Hattie’s view, an effect size of from +0.15 to +0.40 is just the effect that “any teacher” could produce, in comparison to students not being in school at all. He says, “When teachers claim that they are having a positive effect on achievement or when a policy improves achievement, this is almost always a trivial claim: Virtually everything works.
An effect size of 0.00 to +0.15 is, he estimates, “what students could probably achieve if there were no schooling” (Hattie, 2009, p. 20). Yet this characterization of dials and zones misses the essential meaning of effect sizes, which are rarely used to measure the amount teachers’ students gain from fall to spring, but rather the amount students receiving a given treatment gained in comparison to gains made by similar students in a control group over the same period. So an effect size of, say, +0.15 or +0.25 could be very important.
(One of) Hattie’s core claims (is that it) is possible to meaningfully rank educational factors in comparison to each other by averaging the findings of meta-analyses.
These claims appear appealing, simple, and understandable. But they are also wrong.
The essential problem with Hattie’s meta-meta-analyses is that they accept the results of the underlying meta-analyses without question. Yet many, perhaps most meta-analyses accept all sorts of individual studies of widely varying standards of quality. In Visible Learning, Hattie considers and then discards the possibility that there is anything wrong with individual meta-analyses, specifically rejecting the idea that the methods used in individual studies can greatly bias the findings.
To be fair, a great deal has been learned about the degree to which particular study characteristics bias study findings, always in a positive (i.e., inflated) direction. For example, there is now overwhelming evidence that effect sizes are significantly inflated in studies with small sample sizes, brief durations, use measures made by researchers or developers, are published (vs. unpublished), or use quasi-experiments (vs. randomized experiments) (Cheung & Slavin, 2016).
Many meta-analyses even include pre-post studies, or studies that do not have pretests, or have pretest differences but fail to control for them. For example, I once criticized a meta-analysis of gifted education in which some studies compared students accepted into gifted programs to students rejected for those programs, controlling for nothing!
A huge problem with meta-meta-analysis is that until recently, meta-analysts rarely screened individual studies to remove those with fatal methodological flaws. Hattie himself rejects this procedure: “There is…no reason to throw out studies automatically because of lower quality” (Hattie, 2009, p. 11).
In order to understand what is going on in the underlying meta-analyses in a meta-meta-analysis, is it crucial to look all the way down to the individual studies. . .
Hattie’s meta-meta-analyses grab big numbers from meta-analyses of all kinds with little regard to the meaning or quality of the original studies, or of the meta-analyses. . .
To create information that is fair and meaningful, meta-analysts cannot include studies of unknown and mostly low quality. Instead, they need to apply consistent standards of quality for each study, to look carefully at each one and judge its freedom from bias and major methodological flaws, as well as its relevance to practice. A meta-analysis cannot be any better than the studies that go into it. Hattie’s claims are deeply misleading because they are based on meta-analyses that themselves accepted studies of all levels of quality.
Slavin makes some exceptional statistical and methodological points. . . that should be added to the points I have already cited above. NOTE that we are discussing the process and decision rules that Hattie is using when conducting his statistical analyses.
Educators must understand that these decision rules—which are most often determined by the individual(s) conducting the research—can influence the results and conclusions of the research.
_ _ _ _ _
On July 17, 2018, Slavin added to his critique—responding to Peter DeWitt who defended Hattie’s approaches. In this Education Week Letter to the Editor, he stated:
My whole point in the post was to note that Hattie's error is in accepting meta-analyses without examining the nature of the underlying studies. I offered examples of the meta-analyses that Hattie included in his own meta-meta-analysis of feedback. They are full of tiny, brief lab studies, studies with no control groups, studies that fail to control for initial achievement, and studies that use measures made up by the researchers.
In DeWitt's critique, he has a telling quote from Hattie himself, who explains that he does not have to worry about the nature or quality of the individual studies in the meta-analyses he includes in his own meta-meta-analyses, because his purpose was only to review meta-analyses, not individual studies. This makes no sense. A meta-analysis (or a meta-meta-analysis) cannot be any better than the studies it contains.
If Hattie wants to express opinions about how teachers should teach, that is his right. But if he claims that these opinions are based on evidence from meta-analyses, he has to defend these meta-analyses by showing that the individual studies that go into them meet modern standards of evidence and have bearing on actual classroom practice.
_ _ _ _ _
Bergeron and Rivard’s 2017 Concerns with Hattie’s Work
While Slavin provides an important research and practitioner perspective, Drs. Pierre-Jerome Bergeron and Lysanne Rivard provide an important statistical perspective.
[CLICK HERE for their original article]
Summarizing their McGill Journal of Education article, “How to Engage in Pseudoscience with Real Data: A Criticism of John Hattie’s Arguments in Visible Learning from the Perspective of a Statistician,” they make the following points:
- Hattie’s meta-meta-analyses ignore the presence of negative probabilities; He confounds correlation and causality.
- Hattie believes that Effect Sizes from separate meta-analytic studies can be compared because Cohen’s d is a measure without a unit/metric; his averages, therefore, do not make sense.
- In conducting meta-meta-analyses, Hattie is comparing Before Treatment versus After Treatment results, not (as in the original meta-analyses he uses) Treatment versus Control Group results.
- Hattie pools studies that have different definitions (and measurements of) student achievement, and treats them as one and the same.
- Hattie believes that effects below zero are bad. Between 0 and 0.4 we go from “developmental” effects to “teacher” effects. Above 0.4 represents the desired effect zone. There is no justification for this classification.
For people interested in more detail regarding these points, please go to the original article.
But before you go, here are some of the comments you will read:
The work of John Hattie on education contains, seemingly, the most comprehensive synthesis of existing research in the field. Many consider his book, Visible Learning, to be a Bible or a Holy Grail.
For those who are unaccustomed to dissecting numbers, such a synthesis does seem to represent a colossal and meticulous task, which in turn gives the impression of scientific validity. For a statistician familiar with the scientific method, from the elaboration of research questions to the interpretation of analyses, appearances, however, are not sufficient. The researcher from New Zealand obviously has laudable intentions, which we describe first and foremost. Good intentions, nevertheless, do not prevent major errors in Visible Learning.
In reading Visible Learning, anybody who is knowledgeable in statistical analysis is quickly disillusioned. Why? Because data cannot be collected in any which way nor analyzed or interpreted in any which way either. Yet, this summarizes the New Zealander’s actual methodology.
Fundamentally, Hattie’s method is not statistically sophisticated and can be summarized as calculating averages and standard deviations, the latter of which he does not really use. He uses bar graphs (no histograms) and is capable of using a formula that converts a correlation into Cohen’s d (which can be found in Borenstein, Hedges, Higgins, & Rothsten, 2009), without understanding the prerequisites for this type of conversion to become valid.
_ _ _ _ _ _ _ _ _ _
My Perspective: How Do You Go from Effect to Effective Practice?
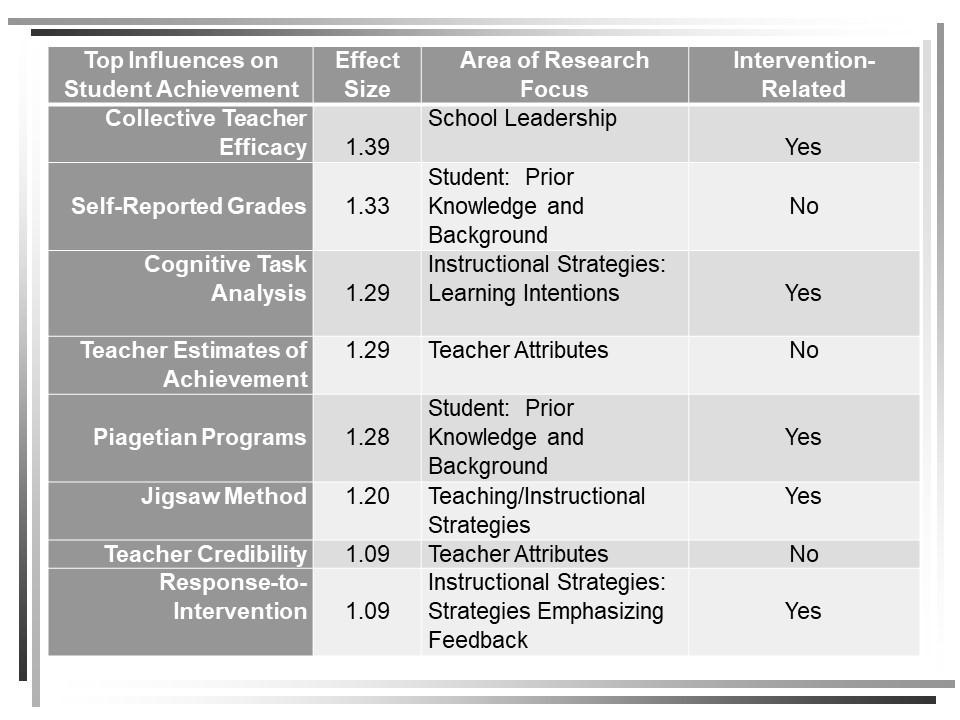
In the most-current (October, 2018) version of Hattie’s Visible Learning effect sizes, Hattie has organized more than 250 variables into clusters that include: Student, Curricula, Home, School, Classroom, Teacher, and Teaching.
In the Figure below, I have listed the top eight effect sizes with their respective “Areas of Research Focus.”
I have also added a descriptor identifying whether each variable can be changed through an external intervention. Thus, I am saying that “Students’ Self-Reported Grades,” “Teacher Estimates of Student Achievement,” and a “Teacher’s Credibility with his/her Students” cannot be changed in a sustained way through some type of intervention, and that—even if they could—they would not causally change student achievement.
Parenthetically, in most cases, these three variables were independent variables in the research investigated by Hattie.
At this point, we need to discuss how to go from “effect to effective practice.” To do this, we need to understand exactly what each of the variables in the Figure actually are.
And . . . OK . . . I’ll admit it.
As a reasonably experienced school psychologist, I have no idea what that vast majority of these approaches actually involve at a functional school, classroom, teacher, or student level. . . much less what methods and implementation steps to use.
To begin to figure this out, we would need to take the following research-to-practice steps:
- Go back to Hattie’s original works and look at his glossaries that define each of these terms
- Analyze the quality of each Hattie meta-meta-analysis in each area
- Find and analyze each respective meta-analysis within each meta-meta-analysis
- Find and evaluate the studies included in each meta-analysis, and determine which school-based implementation methods (among the variety of methods included in each meta-analysis) are the most effective or “best” methods—relative to student outcomes
- Translate these methods into actionable steps, while also identifying the provide the professional development and support needed for sound implementation
- Implement and evaluate the short- and long-term results
If we don’t do this, our districts and schools will be unable to select the best approaches to enhance their student achievement and implement these approaches in the most effective and efficient ways?
This, I believe, is what the researchers are not talking about.
_ _ _ _ _
The Method is Missing
To demonstrate the research-to-practice points immediately above, let’s look at two related approaches on Hattie’s list:
- Response to Intervention (Effect Size: 1.09)
- Interventions for Students with Learning Needs (Effect Size: 0.77)
Hattie’s Glossary defines Response to Intervention as “an educational approach that provides early, systematic assistance to children who are struggling in one or many areas of their learning. RTI seeks to prevent academic failure through early intervention and frequent progress measurement.”
In Visible Learning for Teachers, Hattie devotes one paragraph to Response to Intervention—citing seven generic “principles.”
None of this description would effectively guide any district or school in how they should operationalize Response to Intervention, and implement a sound outcome-based system or set of approaches.
To do this, school leaders would have to follow the research-to-practice steps outlined above.
_ _ _ _ _
Hattie’s meta-analytic research recently added Interventions for Students with Learning Needs.
However, given my research, there are no published glossaries that define this new construct. And, the meta-meta-analytic studies that were used to define this construct are not available—if one wanted to follow the research-to-practice steps again outlined above.
Previously, Hattie identified Comprehensive Interventions for Learning Disabled Students as having one of the five top effect sizes relative to impacting student learning and achievement.
In the Visible Learning for Teachers Glossary, it was noted that:
The presence of learning disability can make learning to read, write, and do math especially challenging. Hattie admits that “it would be possible to have a whole book on the effects of various interventions for students with learning disabilities” (Hattie 2009), and he references a 1999 meta-study.
To improve achievement teachers must provide students with tools and strategies to organize themselves as well as new material; techniques to use while reading, writing, and doing math; and systematic steps to follow when working through a learning task or reflecting upon their own learning. Hattie also discusses studies that found that “all children benefited from strategy training; both those with and those without intellectual disabilities.
_ _ _ _ _
Even though this construct is now gone, if a school or district was still using this book—from a research-to-practice perspective—once again, there is no specificity here. No one reading Hattie’s books—or looking at the Corwin Press website—would have a clue as to where to begin to operationalize a sound implementation process.
More specifically: Hattie described Comprehensive Interventions for Learning Disabled Studentsin the plural.
And so. . . from Hattie’s research, which learning disabilities did his meta-analytic studies address? What were the specific interventions? At what age and level of severity did the interventions work with students? And, how was “success” defined and measured?
As Hattie himself noted. . . he could write a book just in this area (and some esteemed educators have).
But once again, while it is important to know that some interventions for learning disabled students work, one would have to apply the research-to-practice steps above, be able to evaluate the research-to-practice in a specific area of learning disabilities, and have the training and consultation resources needed to help teachers implement these interventions “in real time.”
But now, we have an additional dilemma. What research-based criteria went into Hattie’s label change to Interventions for Students with Learning Needs, and what does this “new” variable or construct mean?
_ _ _ _ _
Summary. All of this must be incredibly confusing and challenging to educators in the field. Indeed, if Hattie’s list of effects is constantly changing—both in rank order and in name—how do we keep up with the changes and make the practitioner-oriented programmatic decisions that need to be made?
Moreover, just because we know that a program, strategy, or intervention significantly impacts student learning, we do not necessarily know the implementation steps that were in the research studies used to calculate the significant effect . . . and we cannot assume that all or most of the studies used the same implementation steps.
_ _ _ _ _ _ _ _ _ _
The Questions to Ask the Outside “Hattie Consultants”
As noted earlier, in order for districts and schools to know exactly what implementation steps are needed to implement effective “Hattie-driven” practices so that their students can benefit from a particular effect, we need to “research the research.”
And yet, the vast majority of districts—much less schools—have the personnel with the time and skills to do this.
To fill this gap: We now have a “cottage industry” of “official and unofficial” Hattie consultants who are available to assist.
But how do districts and schools evaluate these consultants relative to their ability, experience, and skills to deliver effective services?
With no disrespect intended, just because someone has been trained by Hattie, has heard Hattie, or has read Hattie—that does not give them the expertise, across all of the 250+ rank-ordered influences on student learning and achievement, to analyze and implement any of the approaches identified through Hattie’s research.
And so, districts and schools need to ask a series of specific questions when consultants say that their consultation is guided by Hattie’s research.
Among the initial set of questions are the following:
- What training and experience do you have in evaluating psychoeducational research as applied to schools, teaching staff, and students—including students have significant academic and/or social, emotional, or behavioral challenges?
- In what different kinds of schools (e.g., settings, grade levels, socio-economic status, level of ESEA success, etc.) have you consulted, for how long, in what capacity, with what documented school and student outcomes—and how does this experience predict your consultative success in my school or district?
- When guided by Hattie’s (and others’) research, what objective, research-based processes or decisions will you use to determine which approaches our district or school needs, and how will you determine the implementation steps and sequences when helping us to apply the selected approaches?
- What will happen if our district or school needs an approach that you have no experience or expertise with?
- How do you evaluate the effectiveness of your consultation services, and how will you evaluate the short- and long-term impact of the strategies and approaches that you recommend be implemented in our district or school?
For my part, virtually all of my consultation services are based on a series of initial conference calls where I listen to the educators involved relative to their current status, needs, desired outcomes, and commitment to the change process. This is complemented by an off-site analysis of the data, documentation, and outcomes in the areas relevant to the identified concerns.
Most of this is done to determine (a) the willingness of everyone potentially involved in the change process to engage in that process; and (b) whether or not I am a good “match” to help facilitate the process.
Next: My next step is an on-site “Plan for Planning” visit where we meet with and listen to the people (inside and, sometimes, outside of the district) most relevant to the initiative, and continue the information gathering and analysis process.
Ultimately, this process represents a needs assessment, resource and SWOT (Strengths, Weaknesses, Opportunities, Threats) analyses, and the beginning of the leadership planning that eventually results in the identification of specific approaches and implementation steps—all written in a proposed Action Plan.
Moreover, in the area of concern, this process and plan detail exactly what student-centered services, supports, programs, and interventions (a) already exist—so they can be strengthened and sustained; (b) are needed—so they can be planned and implemented; and (c) are not working, are redundant or working at cross-purposes with other approaches, or are not needed—so they can be phased out and eliminated.
Finally: The educational leaders and I collaboratively decide if I have the expertise to help implement the Plan and, if so, we need to independently decide if we want to continue our relationship together.
If I do not have the expertise to help a district or school in a specific area, I typically recommend two to four colleagues who I believe have the skills—and then let the district or school leaders contact and vet them on their own.
If I have the expertise, but do not feel comfortable with the “match” or the time or intensity of services needed, I again recommend other colleagues.
If I have the expertise, but the district or school leaders want to go a different direction (perhaps, they feel they have the expertise in-house or more immediately available), then we part as colleagues and friends.
_ _ _ _ _ _ _ _ _ _
Summary
Once again, none of the points expressed in this Blog are personally about John Hattie. Hattie has made many astounding contributions to our understanding of the research in areas that impact student learning and the school and schooling process.
However, many of my points relate to the strengths, limitations, and effective use of research reports using meta-analysis and meta-meta-analyses.
If we are going to translate this research to sound practices that impact student outcomes, educational leaders need to objectively and successfully understand, analyze, and apply the research so that they make sound system, school, staff, and student-level decisions.
To do this, I have suggested (from earlier in this Blog) the following Multiple-gating approach:
- Step 1. Identify your school’s history and status, resources and capacity, and current positive and needed outcome relative to student achievement.
- Step 2. Determine which Hattie variables will most improve student achievement—with a constant awareness that many of these variables will interact or are interdependent.
- Step 3. Evaluate the methodological and statistical quality and integrity of the meta-analytic studies that Hattie included in his meta-meta-analyses.
NOTE: If Hattie’s meta-meta-analysis has flaws or included flawed meta-analytic studies, identify the best separate meta-analysis studies and continue this multiple-gating process.
- Step 4. Evaluate the demographics and other background characteristics of the schools, staff, and students involved in the meta-analytic studies used by Hattie in his meta-meta-analyses to validate that they match the school demographics and background characteristics where you plan to implement the program, strategy, or intervention.
- Step 5. Using and analyzing Hattie’ best meta-meta-analytic study (or the best individual meta-analysis studies—as immediately above), identify what program(s) or strategy(ies), and what specific implementation approaches and steps were most responsible for the positive effects on student achievement.
- Step 6. Finalize the select of your program or strategy, and its implementation approaches and steps, and develop an Implementation Action Plan that identifies who will be involved in implementation, what training and resources they need, how you will engage the students (staff, and parents), how you will evaluate the short-and long-term student achievement outcomes, and what will be the implementation steps and timelines.
- Step 7. Resource, train, engage, implement, evaluate, fine-tune, implement, and evaluate.
_ _ _ _ _
Given the limited resources of most districts and schools, they will likely look to outside consultants for assistance. But if the educational leaders are going to use other staff or outside consultants to guide the process, they must ask the questions and get the answers to ensure that these professionals have the knowledge, skills, and experience to accomplish the work.
Still too often, districts and schools are “blinded” by consultants who use their affiliations to “validate” their expertise, rather than their research-to-practice experience and field-based success.
In the end, schools and districts should not invest time, money, professional development, supervision, or other resources in programs or interventions that have not been fully validated for use with their students and/or staff.
Such investments are not fair to anyone—especially when they (a) do not delivering the needed results, (b) leave students further behind, and/or (c) fail and create staff resistance to “the next program”—which might, parenthetically, be the “right” program.
_ _ _ _ _
I hope that this discussion has been useful to you.
As always, I look forward to your comments. . . whether on-line or via e-mail.
If I can help you in any of the areas discussed in this Blog, I am always happy to provide a free one-hour consultation conference call to help you clarify your needs and directions on behalf of your students, staff, school(s), and district.
Best,