Students’ Discipline Problems are Increasing Nationally Despite Widespread SEL Use
Dear Colleagues,
Introduction
Happy June !!!
With everyone consumed with testing, end-of-year activities, and graduations, it may seem counterintuitive that this is one of the busiest times of the year for me as a school improvement consultant. And it’s not because I am doing a lot of presentations during the professional development days that some districts have once students leave for summer vacation.
[In fact, I never really understood the value of doing professional development in June (a) when staff are focused more on their vacations than on the training; (b) when new staff, who are hired later in the summer, have obviously missed the training; and (c) when many staff “lose” the essence of the training during the summer—just like the “learning losses” that we all experience with students.]
No. . . my time right now as a consultant is typically spent with my School and District Leadership Teams as we analyze this past year’s outcomes, and make strategic plans and organizational decisions for how the new year needs to start.
In fact, these activities are a continuation of the theme that I discussed in my last Blog, The Beginning of the Next School Year Starts Now: The Get-Go Process . . .
[CLICK HERE to Re-Read]
. . . where I discussed the importance of reviewing, in April or May, every students’ end-of-year academic and behavioral status, and how much they learned and progressed during the entire school year.
We recommended that this information be systematically used (a) to make student class assignments (so that teachers can effectively differentiate instruction); (b) to identify needed multi-tiered services and supports (so that these are in place on the first day of the new school year); and (c) to determine the best personnel arrangements (so that schools with greater student needs receive “Core Plus” staffing).
_ _ _ _ _
Whether on a student level or an organizational level, the theme here is:
“The Beginning of the New School Year Starts in April.”
And the functional point of the theme is that:
When schools complete evaluations of their organizational, curricular, instructional, intervention, and student processes in April, May, and June, they can use the data to (a) align and adapt existing resources; (b) acquire and activate new resources; and/or (c) retire or reserve other, unneeded resources all to address as many students’ collective and individual needs on the first day of the new year.
_ _ _ _ _
Today’s Blog (Part I of III) encourages schools to evaluate their Social-Emotional Learning (SEL), Positive Behavioral Support System (PBSS), or school safety and discipline systems and outcomes for this past year.
We are recommending that schools analyze their discipline data now (we will show you how below) so that they can identify large-scale school problems that have consumed significant amounts of staff time this past year. Once these problems are specifically analyzed, the goal is to design any needed organizational, procedural, or instructional strategies or interventions during the summer so they can be implemented on the first day of the new school year.
To create a context toward improving schools’ SEL programs, this Blog will first review a number of recent national reports that surveyed educators about students’ behavioral problems in their schools, and other reports suggesting that bullying (including cyberbullying) is increasing in our schools nationwide.
_ _ _ _ _
In Part II of this Blog Series, we will introduce our Special Situation Analysis process, and apply it to analyzing and developing systemic interventions for school bullying. The hope is that schools will use this process, once again, to develop and implement “prevention and early response” approaches now . . . for immediate roll-out on the first day of the new school year.
In Part III of this Series, we will use the Special Situation Analysis process to address cafeteria and bus situations.
_ _ _ _ _ _ _ _ _ _
The Back Story
While I am constantly reading new national reports and following different thought-leaders, many of these Blogs also begin with a recent consultation experience.
As noted above, I spend many consultation meetings at the end of the school year helping districts and schools to comprehensively analyze their end-of-year student, staff, and system data, so that we can consciously plan for the next school year. I was doing just this last week with three urban high schools as we moved to “Year 2” of the new multi-tiered system of supports that we have been designing and initiating.
During one conversation, as we were analyzing their discipline and SEL outcome data, it became apparent that the schools were reactively dealing with almost-daily “cyber-dramas” that were escalating into classroom disruptions, peer conflicts, and innumerable fights. These situations were not only were negatively impacting school safety and climate, but they were necessitating time-consuming threat analyses, crisis-containment “Code Blues,” and post-incident interviews and debriefings.
All of this was dominating the time of administrators, counselors, social workers, and school psychologists. In fact, on some days, it was nearly impossible for these professionals to have a meeting. . . as one student “blow-up” after another created a series of constant interruptions.
And all of this was residually impacting other students and many classroom teachers.
When I began asking questions in our Special Situation Analysis protocol, it was clear that we did not have a full understanding of the different root causes of the problem. We did, however, know that many of the problems were originating from students’ out-of-school interactions on social media.
The district and these three schools also had to acknowledge that their “SEL program” was not having “real-life” impact. That is, it looked great on paper, but the time, staff, and process was not producing a social, emotional, or behavioral “return on investment.”
The schools are now conducting a full Special Situation Analysis so that they can roll-out a more effective, multi-faceted process to prevent and address their cyber-dramas beginning this August.
_ _ _ _ _ _ _ _ _ _
Recent Reports on Social-Emotional Learning Outcomes
To begin this section, we need to emphasize that it does not matter what label a school uses for its school discipline program. Whether it is SEL, PBIS, PBSS, or anything else . . . district and school leaders need to understand that the ultimate focus is on enhancing students’ social, emotional, and behavioral self-management—from preschool through high school—and that the process requires a multi-tiered continuum of services, supports, strategies, and interventions for the challenging students who are not responding to the preventative approaches.
Moreover, as discussed in many previous Blogs, a school’s SEL, PBIS, PBSS, teasing and bullying, trauma sensitive, and school discipline/ classroom management approaches should all be integrated and based on the same science-to-practice principles and practices.
The biggest problem and what does matter in school discipline today is that some school leaders do not recognize the principle above, and their school ends up implementing multiple (sometimes redundant, sometimes conflicting, sometimes innocuous) school-wide initiatives that end up (a) wasting staff development and implementation time, and (b) not producing desired student outcomes.
I am not blaming anyone here. Many administrators do not have the psychological or behavioral background needed, and they are doing the best that they can with the understanding (and resources) that they have.
But the bottom line is that: Schools’ science-to-practice gaps represent a primary reason for their lack of sustained returns on their SEL, PBIS, etc. investments.
[CLICK HERE for a Past Discussion:
The SEL-ing of Social-Emotional Learning: Education’s Newest Bandwagon. . . Science-To-Practice Goals, Flaws, and Cautions
_ _ _ _ _
Three Recent SEL Reports
As a backdrop to a broader, more focused SEL discussion, let’s overview three recent national survey reports.
Report 1
A recent survey of 800 nationally-representative kindergarten through high school principals was completed by the MCH Strategic Data company and published last month as K-12 Principals’ Assessment of Education.
As reported in Education Week on May 15, 2019,
[CLICK HERE for the Story]
the principals’ top concerns were: Adequate funding, Student attendance, Teacher morale, Behavior issues in students, and Aligning assessments to standards.
When considering these issues together, the Student Behavior issues stood out. The MCH reported stated:
Behavior issues in students is of great concern to most principals who responded to our survey. Principals specifically called out the need for adequate staff and resources to care for students who have social and emotional learning needs, mental health issues, or other customized needs.
The lack of resources and funding also contributes to low teacher morale and fewer qualified teachers entering the profession. Being able to increase pay for teachers, provide greater professional development opportunities, and purchase additional resources would help tremendously with these issues.
However, principals still struggle with finding adequate funding and resources to provide the educational opportunities and school culture required to address the learning challenges of their student bodies.
_ _ _ _ _
Report 2
On February 14, 2019, research company EAB published a report, Breaking Bad Behavior, that validates and extends the MCH Report above relative to elementary students’ behavioral challenges.
[CLICK HERE for Report]
EAB surveyed over 320 district or school administrators, over 1,100 general education and 300 special education kindergarten through fifth grade teachers, and over 150 related service professionals asking them about their concerns about student behavior.
The Report cited the following trends:
- Teachers and Administrators Report an Alarming Recent Increase in Disruptive Behavior. The vast majority of educators perceive student misbehavior to be on the rise, regardless of their position or background. However, teachers report disruptions among a much larger percentage of their students than administrators.
- Districts and Schools Lack Clear and Consistent Behavior Management Guidelines. Most districts and schools do not have a clearly communicated and consistently followed protocol for managing behavioral disruptions. Guidelines or recommendations for how to handle disruptive behavior often do not reach school administrators or teachers.
- Teachers Report Lack of Preparation and Support in Managing Disruptive Behavior. Teachers report feeling unprepared and poorly supported by school leaders in managing their classrooms. Training in evidence-based programs varies from teacher to teacher and school to school, making it difficult to assess what works.
Critically, the EAB Report stated that all of the districts surveyed reported using PBIS, but only 57% of the teachers reported using PBIS practices frequently in their work. In addition, 93% of the districts reported using an SEL curriculum, but only 25% of the teachers reported using an SEL curriculum in their classrooms.
_ _ _ _ _
Report 3
The third report, Teacher and Principal Perspectives on Social and Emotional Learning in America’s Schools, published earlier this year by the Rand Corporation, is based on a Spring, 2018 survey of the American Educator Panels that involved 15,719 nationally-representative teacher and school principal respondents. These educators answered questions about the importance and value of SEL in schools, how they were promoting and measuring SEL, and how they thought SEL approaches could be improved.
[CLICK HERE for the Report]
The Key Findings according to the Report were:
- Large majorities of principals described SEL as a top priority.
- Most educators rated a wide range of SEL skills as important, although teachers tended to assign greater importance to SEL skills than principals.
- Educators believed that SEL programs can improve student outcomes and school climate.
- Elementary teachers and principals tended to use SEL programs and curricula, while teachers and principals in secondary schools tended to use informal practices.
- Educators reported using a variety of strategies, ranging from classroom activities to community outreach, to improve students' SEL skills.
- Schools used a variety of SEL initiatives and curricula; positive behavior systems and trauma-informed practices were common.
- Majorities of teachers and principals reported that their schools measured SEL.
- Majorities of principals and teachers received training to support SEL; in-service training was more common than pre-service training.
- Many principals and teachers reported that having more time would improve their school's ability to address SEL.
_ _ _ _ _
Analysis
Earlier SEL surveys (e.g., McGraw-Hill’s Education 2018 Social and Emotional Learning Report involving 1,000 administrators, teachers, and parents) have reported that nearly 67% of the educators said that their school is in the process of implementing a school-wide strategic SEL plan. In addition, while just 22% of the educators said that they felt “very prepared” to teach SEL and 51% said the level of SEL professional development at their school was not sufficient, 75% of the teachers said that they were “teaching SEL” in their classrooms.
Critically, if educators are expecting social-emotional learning approaches (in Study 2) to address the behavioral issues exhibited by students (in Study 1), we have to do better. Principals and teachers need to be implementing evidence-based SEL approaches that have demonstrated their ability to change students’ behavior in sustained ways.
And yet, based on our research and analysis, we believe that the SEL framework, as advocated by the Collaborative for Academic, Social, and Emotional Learning (CASEL), has a number of significant flaws.
These flaws include:
- CASEL’s approach to SEL in the schools is to provide a loose implementation framework, and to tell schools to “create your own initiative.” This means that SEL programs across schools cannot be objectively compared or validated, and that many schools may be implementing ineffective approaches that are not producing demonstrable student-focused social, emotional, or behavioral outcomes.
- CASEL’s five SEL outcomes (Self-Awareness, Self-Management, Social Awareness, Relationship Skills, and Responsible Decision-Making) were not scientifically derived, they have never been validated, and they are largely constructs that cannot be reliably or validly measured because they are not discretely observable.
- Some of the meta-analytic research used by CASEL to validate SEL approaches were conducted internally by CASEL leaders and were not independently and objectively reviewed or published. A review of this research indicates that this research has significant methodological flaws that call their conclusions into question.
- The only CASEL-sponsored meta-analytic study that was published in an independent professional journal also had significant methodological shortcomings.
- CASEL is now sponsoring activities focused on improving the evaluation of SEL outcomes. This begs the question: “If CASEL acknowledges that current SEL evaluation instruments and tools are lacking, how can it use existing studies that have utilized these instruments to validate its empirical foundation?”
- CASEL’s SEL framework does not address students’ gender, age, cultural, racial, or socio-economic differences; and it does not address the multi-tiered service and support needs of students with disabilities and other behavioral/mental health issues.
In the final analysis, it is difficult to determine the efficacy of SEL initiatives when most of them significantly differ. Given this, individual districts and schools need to determine whether their SEL programs or strategies are changing student behavior.
As I have said many time before:
Schools don’t credit for activity; they get credit for student outcomes.
If schools are investing time, training, resources, and effort on SEL programs or strategies, they need to evaluate and be guided by their results. If the approaches are not working, they may need to consult with an expert who understands the psychoeducational research, and how to operationalize and individualize that research into student-focused practices that create and sustain social, emotional, and behavioral change.
_ _ _ _ _ _ _ _ _ _
Recent Reports on School Safety and Bullying
Two reports have recently been published that involve surveys of students and others on school safety and bullying and their various characteristics and locations. In combination, they suggest that school bullying is on the rise, and that cyberbullying remains a significant bullying problem.
Report 1
A June 3, 2019 article in Education Week by Kelson Goldfine from YouthTruth, a San Francisco-based national non-profit that directly surveys student to give educators feedback on the impact and meaningfulness of their school initiatives, referenced their recently released report, Learning from Student Voice: Bullying Today. This report analyzed responses from students during the 2015-16, 2016-17, and 2017-18 school years regarding their experiences with school climate and safety.
For example, during the 2017-18 school year, YouthTruth analyzed anonymous feedback from over 180,000 students across 37 states in grades five through twelve. They discovered that most bullying happens in person, and that victims believed they were bullied (in rank order) because of their appearance, their race or skin color, and because other students thought they were gay.
The primary accumulated results in the Report were:
- Just over half of students feel safe at school. 59% of students feel safe at school generally. More specifically, 54% feel safe in hallways, restrooms, and locker rooms. Similarly, 55% say they feel safe on school property outside the school building.
- Bullying and peer-on-peer harassment remain common and are increasing. Only 66% of students report that adults at their school try to stop bullying and harassment, and a recent report shows bullying is on the rise.
- One in 3 students report that they must be ready to fight to defend themselves at school. The data show that middle school students experience higher rates of bullying than high school students, and they are more likely than high school students to observe physical fighting and feel that they must be ready to fight to defend themselves.
- Majority White schools have higher rates of bullying. In majority White schools, students of color experienced a steeper increase in bullying than white students last year.
- Black or African-American students are more likely than white students to feel that they must be ready to fight to defend themselves. 41% of black or African-American students indicated they feel they must be ready to protect themselves at school, compared with only 21% of white students.
The Education Week article also noted that 226,000 students have experienced gun violence in their schools since the Columbine High School massacre 20 years ago, and that states have invested approximately $900 million since the Marjory Stoneman Douglas High School murders—most of the money going to approaches that are “hardening” our schools. Indeed, the Washington Post (November 13, 2018) stated that school security has grown into a $2.7 billion market—which does not even include the costs for armed campus police officers.
And yet, half of those interviewed for the YouthTruth Report—who had witnessed a school shooting—said that nothing would have changed the result, while the other half said that “deeper relationships between students and staff might have helped.”
_ _ _ _ _
Report 2
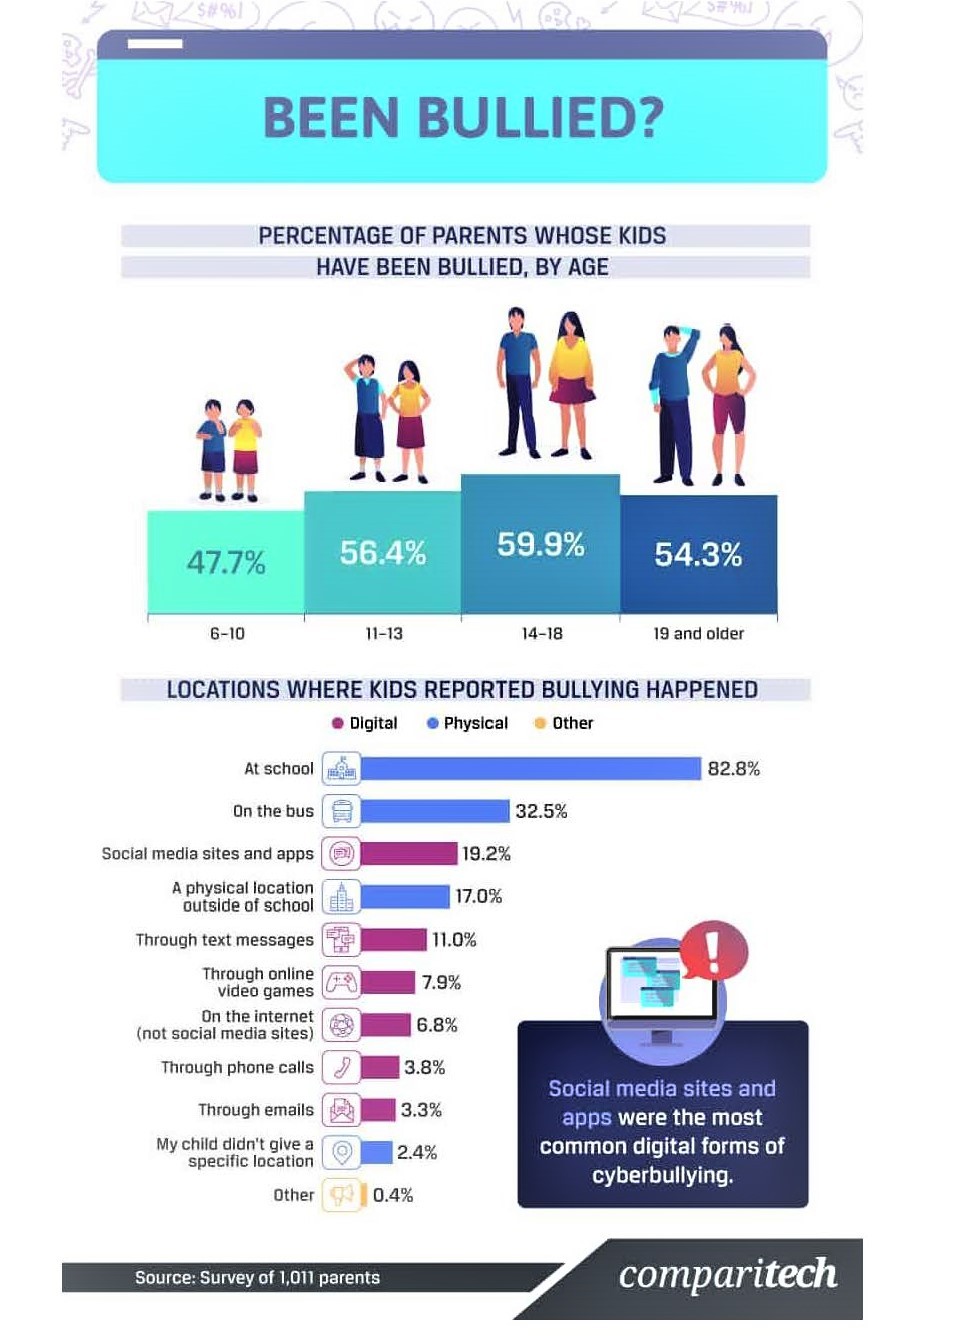
On May 8, 2019, Comparitech published the results of a survey on student bullying completed by over 1,000 parents. Comparitech is a self-proclaimed “pro-consumer website providing information, tools, and comparisons to help consumers in the US, UK and further afield to research and compare tech services.”
The survey found that:
- 47.7% of six- to ten-year-old students and over 50% of those over age eleven have experienced bullying in one form or another (see the Figure below)
- Slightly more than 82.8% of the bullying occurs at school; 32.5% occurs on the school bus; and almost 20% occurs through social media sites and apps (i.e., cyberbullying).
- Relative to social media, 42% reported experiencing cyberbullying on Instagram, 37% on Facebook, and 31% on Snapchat.
While we will discuss how to analyze and potentially intervene with bullying and cyberbullying in Part II of this Blog Series, the remainder of this Blog will focus on the specific data-based analyses that schools should complete in order to evaluate and isolate their school discipline status and challenges from the school year now ending.
_ _ _ _ _ _ _ _ _ _
Analyzing School Discipline Data
While the reports above provide some context or guidance in the areas of student behavior, bullying, and cyberbullying, individual districts and schools need to analyze their own data to determine where they are, what they have accomplished (or not), and what they need to plan for the coming school year.
To do this most effectively, school need to have a high-quality, interactive student information or data management system that tracks—at the very least—students’ Office Discipline Referrals (ODRs) and school suspensions or expulsions across a variety of variables.
Relative to individually-referred students, these variables should include each student’s name, gender, chronological age, grade, race, homeroom teacher, free-lunch status, and disability (i.e., IEP or 504 Plan) status.
Relative to each ODR offense, these variables should document (a) the date, time, and specific place of the offense; (b) a description of the specific offense, with a rating of its intensity; (c) the name of the referring teacher or staff member; (d) whether the offense involved an individual, small group, or large group of students and offenders; (e) whether parents or guardians were notified by phone and/or involved in an in-school meeting; and (f) what consequences or actions were taken as a result of the offense.
Assuming a sound data management system that has the entire 2018-2019 academic year’s worth of accurately-entered data, the following end-of-year reports can be generated, and questions can be answered:
Data Analysis #1. Discipline Offenses by Grade, Students, and Place of Infraction (Divided by the Number of School Days in the Month)
Questions to Answer:
What was the average daily rate of Office Discipline Referrals (ODR) this past month across the school? [These data can be separated by Office Offenses versus Suspendable Offenses; and/or by In-School Suspension Offenses, versus Out-of-School Suspension Offenses.]
What is the average daily rate of ODRs this past month for each grade level and comparatively across grade levels? [These data can be separated by Office Offenses versus Suspendable Offenses; and/or by In-School Suspension Offenses, versus Out-of-School Suspension Offenses.]
What percentage of ODRs across the school occurred in different settings/locations (e.g., Classroom, hallway, bathroom, bus, playground, cafeteria, etc.)?
What percentage of ODRs across the school occurred in different settings/locations (e.g., Classroom, hallway, bathroom, bus, playground, cafeteria, etc.)?
What percentage of ODRs across the school and differentiated by grade level occurred in different settings (e.g., Classroom, hallway, bathroom, bus, playground, cafeteria, etc.)?
Which (rank-order) students (organized by grade level, name, and place of the infraction) had the most ODRs last month?
For all of the Questions Above (if the data are available): How do the data above compare with last month (a month X month bar graph analysis is helpful here)? How do the data above compare with the same month last year (or for the last three or more years)?
_ _ _ _ _
Data Analysis #2. Discipline Offenses by Grade, Gender, Race, Free Lunch, and Disability status (and Place of Infraction, if desired) (Divided by the Number of School Days in the Month)
Data Analysis #3. Discipline Offenses by Grade, Students, Infraction, Place of Infraction, (Number of School Days in the Month)
Questions to Answer:
What (rank ordered) were the most prevalent Infractions this past month across the school? [These data can be separated by Office Offenses versus Suspendable Offenses; and/or by In-School Suspension Offenses, versus Out-of-School Suspension Offenses.]
How did the Infractions vary across grade level and/or across settings/locations? [These data can be separated by Office Offenses versus Suspendable Offenses; and/or by In-School Suspension Offenses, versus Out-of-School Suspension Offenses.]
Which (rank-order) Infractions were done most consistently by the same students (organized by grade level and name?
For all of the Questions Above (if the data are available): How do the data above compare with last month (a month X month bar graph analysis is helpful here)? How do the data above compare with the same month last year (or for the last three or more years)?
_ _ _ _ _
Data Analysis #4. Run Selected Reports as above cross-walked by Day of the Week/Time of the Day of the infraction.
Questions to Answer:
Are there patterns with the data analyses run by student, grade level, location, infraction and the Day of the Week and/or Time of the Day?
_ _ _ _ _
Data Analysis #5. Run Selected Reports as above cross-walked by Staff Person making the Referral.
Questions to Answer:
Are there patterns with the data analyses run by student, grade level, location, infraction and the Staff Person making the Referral?
_ _ _ _ _
Once analyzed, school administrators and other leaders will be able to identify trends in the data. For example, are there specific places in the school, days of the week, or times of the day that are more problematic . . . for all students? for certain grade levels of students? for certain teachers?
As related to our discussion above, are there certain offenses that are occurring more often than others? For example, bullying, cyberbullying, (sexual) harassment, fighting or related physical aggressions? And who, where, and when are these occurring most often?
Finally, school administrators and other leaders can correlate the time, training, resources, and quality of implementation of their different SEL, PBSS, or school discipline activities with these (and related) student data to determine the SEL/PBSS return on investment.
Related to this is the identification of large-scale school behavior problems, and estimates of how much time and how many resources have been required to address these persistent situations.
_ _ _ _ _ _ _ _ _ _
Summary
The discussion in this Blog (Part I of III) focused on encouraging schools to evaluate their Social-Emotional Learning (SEL), Positive Behavioral Support System (PBSS), or school safety and discipline systems and outcomes from the school year that is now ending.
Initially, we created a context to help schools to evaluate (with a goal of improving) their SEL programs by reviewing a number of recent national reports that surveyed educators about students’ behavioral problems in their schools, and other reports suggesting that bullying (including cyberbullying) is increasing in our schools nationwide.
We then recommended that schools analyze their discipline data now so that they can identify large-scale school problems that have consumed significant amounts of staff time this past year.
To assist here, we identified a series of analyses and questions that schools can use to evaluate this year’s discipline data from their student information or data management systems.
In Part II of this Blog Series, we will introduce our Special Situation Analysis process, and apply it to analyzing and developing systemic interventions for school bullying. The hope is that schools will use this process to develop and implement “prevention and early response” approaches now . . . for immediate roll-out on the first day of the new school year.
In Part III of this Series, we will use the Special Situation Analysis process to address cafeteria and bus situations.
_ _ _ _ _
I know that many of you are either finishing your school year, or your school year has just recently ended. And for some of you, the thought of analyzing the data from the year just ended so that you can begin planning (in earnest) for the coming year simply sounds crazy.
But the new school year (for some of you) is less than 10 weeks away.
And if this past year, academically and/or behaviorally, did not go as well as you wanted, and if nothing has been done to address the root causes of these situations, why would anyone think that the new year is going to be a better year?
Moreover, if the information and data that you have in-hand is not analyzed, you may not determine that what you thought was a pervasive student body problem is really isolated to a small group of students, and that the interventions needed by these students is not as daunting as first thought.
_ _ _ _ _
As always, I look forward to your thoughts and comments. Even during the Summer, I am still available to provide a free hour of telephone consultation to those who want to discuss their student, school, and/or district needs.
Feel free to contact me at any time if there is anything that I can do to support your work.
Best,